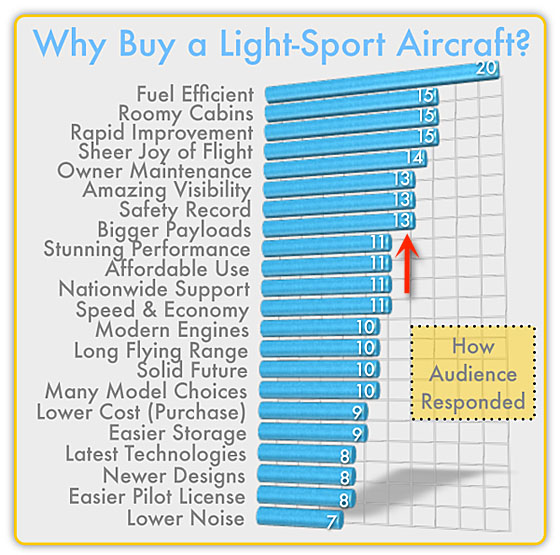
At the Midwest LSA Expo that concluded a few days back, I delivered a presentation called “20+ Reasons to Buy an LSA.” However, to handle the subject a little bit differently, I turned it into an audience participation exercise. As I presented each slide of one particular reason, I explained what was meant and elaborated on how each reason made LSA different from other sorts of aircraft someone might consider buying. Then, I asked the audience to raise their hand if that reason was one that might cause them to buy a Light-Sport. I advised that no one was recording their names, so they remained anonymous. Each person could raise their hand as many times as they wanted or never raise their hand if they chose. No one had to participate. About 35 people listened and somewhere between 15 and 25 answered most of the time. The following chart shows the responses.
2012 LSA Market Shares — Cubs & Surprises
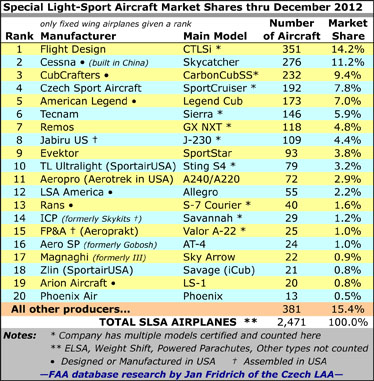
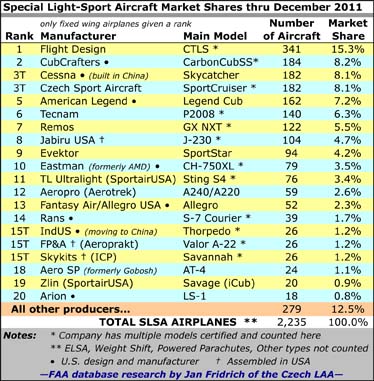
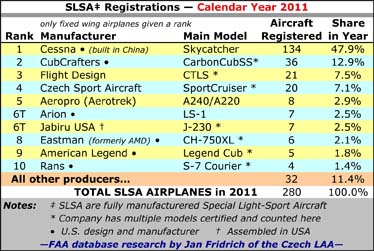
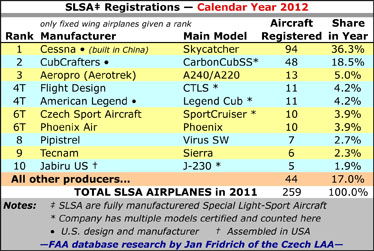
Our annual review of LSA Market Share brings our updated fleet chart and a second chart showing prior-year registrations. While sales of new SLSA remains below par, the market appears to be experiencing spotty but regular recovery from earlier low points. The first half the year foretold a better recovery but the last half of the year stalled somewhat. Regardless, based on traffic to this website, LSA interest is higher than ever. For January 2013, ByDanJohnson.com set all-time records in Unique Visitors and all other measuring criteria Thank you for your support! 2012 Market Share report — Nearby, we present our standard market share numbers. Our original chart remains consistent, illustrating the “installed base,” or “fleet size.” Because we know many of you seek recent-year information we are repeating the Calendar Year chart that debuted last year. For the second year in a row Cessna lead in 2012 with an impressive 94 registrations though this is down 30% from 134 in 2011.
First Half 2012 LSA Registration Update
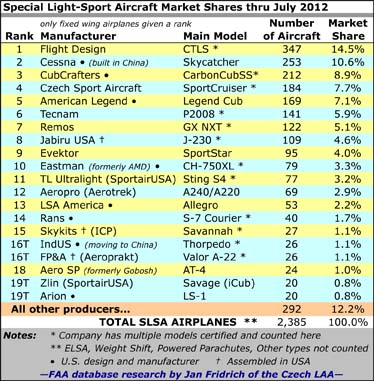
We’ve been getting requests for market share information and I am happy to provide an update, thanks to my European associate Jan Fridrich who does the hard work of sifting through FAA’s database. I remind you that his efforts are not merely tallying whatever FAA publishes. In fairness, Jan has to evaluate many pieces of information and judge accuracy of the entries. This isn’t because FAA’s registrars are bumbling fools that cannot enter data accurately. The challenges come from sheer number of brands (90) and models (127) over a mere seven years… unprecedented in aviation history. To that add the variations of Experimental Amateur Built (EAB), Special Light-Sport Aircraft (SLSA), Experimental Light-Sport Aircraft kits (ELSA) and converted two-place ultralights to LSA status. Then factor in that some standard category or homebuilt aircraft meet the LSA parameters of weight and speed and such so some people consider them “LSA,” when in fact they mean they can be flown by some possessing a Sport Pilot certificate.
Great Internet Year for Recreational Aviation
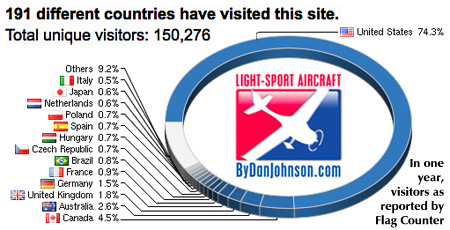
We try not to overdo this, but we have a new benchmark to share with you. *** One year ago, we loaded a new graphic onto our home page. The idea was to better identify where in the world we were finding visitors so we put up Flag Counter, which you can see at the bottom of the Featured Aircraft listing in the right column. It’s been fun to watch the numbers and flags adjust. *** If you click on that image you can get much more info. One thing you’ll see is that we’ve had 191 countries come to visit, including some you may not know existed. Indeed, the entire world has an interest in affordable, recreational aircraft. *** You’ll also note a count of Unique Visitors. At the end of the first year of having this counter on ByDanJohnson.com, we exceeded 150,000 Unique Visitors, according to Flag Counter. Our own stats counter — which doesn’t simply sample as most other counters do, instead counting every visit — shows an even larger number: 181,846 or more than 15,150 per month.
FAA’s 20-Year Forecast; Focus on Light-Sport
FAA issued its 20-year forecast for aviation showing growth prospects for business jets and Light-Sport Aircraft. It also forecasts a decline in the total number of piston-powered aircraft. Viewed from a distance, this might seem beneficial to Light-Sport Aircraft producers and sellers. Reasonably, FAA’s report appears to suggest recreational pilots will enjoy more hours aloft in a growing fleet of LSA. *** Against a backdrop of what seems to be continuously increasing prices for avgas — some believe 100LL might even disappear — the fuel efficiency of LSA becomes more important. For example, Rotax just launched their 912 iS fuel-injected engine boasting a 21% reduction in fuel consumption, taking the popular engine from burning about five gallons per hour to a theoretical four gallons in an hour of flying. Should we LSA enthusiasts celebrate these facts? *** Regretfully, I find FAA’s forecast improbable (see details below). Not that the agency’s number crunchers are wrong; in fact, I hope they might be right.
2011 Market Share Info… and We Set Records
The LSA Market Share numbers are complete for 2011 and we offer them below. But first, if you will permit, I wish to say a hearty thanks to all the visitors that helped ByDanJohnson.com achieve an all-time record month in January 2012 following a strong December 2011. In the first month of the new year we broke nearly every prior record: Unique Visitors, Total Visits, and Hits. We also serve a 25% international audience in nearly every country on Earth. We appreciate the long-term loyalty of our sponsors and each of you who are Members. Your $29 annual donation to this website helps us provide lots of free information. Thank you for your support. 2011 Market Share Report Nearby, we present our standard market share numbers. Our original chart remains consistent, illustrating the “installed base,” or “fleet size.” However, we know many of you want current-year information and therefore we begin our first Calendar Year chart.
Third Quarter 2011 LSA Market Report; Cessna Jumps
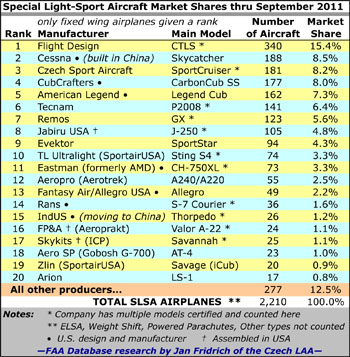
Sure enough, by several measures and based on multiple conversations, 2011 is shaping up to be a better year than 2010. Of course, that’s not saying much as all of aviation worldwide was slow last year and in 2009. When you’re near the bottom of the well, everything starts looking up. *** With those thoughts in mind, we present the newest market share report, this one through the third quarter of 2011. In recent years we’ve had folks tell us we ought to show charts of this year’s or this quarter’s performance. But most readers want to know the “installed base,” to borrow a phrase from the trend-setting tech industry. When people talk about Windows versus Apple market share or iOS versus Android, they generally mean how many of all buyers have those systems. *** Nonetheless, we recognize pilots are hungry for more recent info. So for several years, we have discussed near-term performance in the text of our articles even while we present a graphic showing FAA N-number registrations since the beginning.
First Half 2011 LSA Market Report
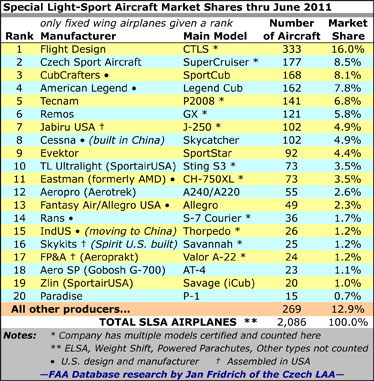
Several readers have asked and we are finally delivering. Jan Fridrich and I present the LSA Market Share Report for the first half of 2011. Figures show a mimicking of 2010 output and that was not a strong year. However, the numbers are not down from 2010 so you could see stability if not growth. *** In the first half of 2011 six companies account for almost 90% of registrations and Cessna alone accounted for precisely half of these. The other five producers: CubCrafters (17% of all first half 2011 deliveries), Czech Aircraft Works (including PiperSport, 13%), Flight Design (7%), Jabiru (4%), and Aerotrek (3%). *** The Over-100 Club now has eight members (chart) up from six at the end of 2010. Our numbers reflect total fleet size, so growth measured this way is inevitable. This method of illustrating market share identifies the strongest producers since 2005.
Irony in 2010 Market Share Report
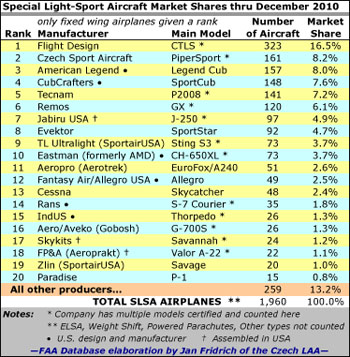
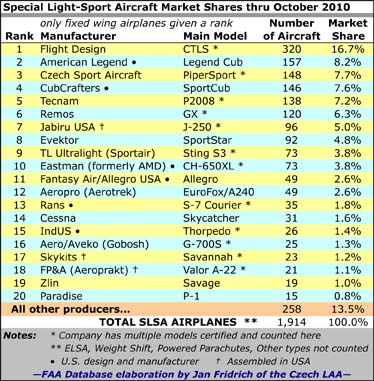
You just have to marvel how a dynamic new industry unfolds. No matter your level of expertise — in or out of government, large or small private organization, or even as an individual guru — no one can exactly foretell the future of the grand experiment we call Light-Sport aviation. *** So, what’s the irony? After all the years I’ve released the results of Jan Fridrich’s laborious market share assessments using FAA data, one company has finally displaced perpetual #2 producer, American Legend. The star that rose is, of course, Piper, who not quite one year ago announced they would distribute the then-Sport Cruiser. That model (with its own winding tale) had done respectably well on its own and Piper’s legacy brand brought an impressive growth spurt even during a very weak economy. Yet, even as Piper rose from 6th place last year to dislodge the Legend Cub producer, the Vero Beach outfit ended their relationship with Czech Sport Aircraft.
Strong Survive, Even Thrive in Another Slow Year
Accompanying this article is our customary chart showing market share of the entire fleet of LSA. I’ve received a few comments over recent months that we should emphasize current-period results. Market share for many products, computers, for example, are given as total market share (“Windows has 90% of the market.”). *** In truth, I have reported current-period results in the article text for the last few updates. We’ve collected all market reports to make reviewing them easier. Here’s a look-back with emphasis on results only for 2010. *** With 83% of the year (10 months) accounted for, Piper‘s legacy brand is convincingly leading the market. At 43 airplanes registered in 2010 (24% of all registrations), the Vero Beach, Florida company is rising rapidly. Note as always that these figures do not match actual sales activity at companies. *** Following Piper, CubCrafters is enjoying a strong year, said Jim Richmond at AOPA as his company added 37 LSA registrations (20% of all ’10 LSA).
- « Previous Page
- 1
- 2
- 3
- 4
- 5
- 6
- …
- 8
- Next Page »