A pair of Sonex aircraft sit on the ramp in Oshkosh, Wisconsin, home airport for this developer of well-priced kits.
At the recently concluded Sebring Sport Aviation Expo, I heard from a number of pilots and vendors about this website publishing fresh market share data. This clearly has value to anyone in the business but it also brings rewards for pilots trying carefully to choose a new aircraft.
Having roamed widely around the Internet to check multiple references, I can confidently state that this information is available from no other source.
Even though our information comes from FAA’s registration database, as our earlier articles about this renewed effort explained (here and here), the computer records needed some serious massaging to properly interpret a large number of make and model variations. Even a recently retired FAA official told me his former office has already begun using our Tableau Public presentation because the data is more user-friendly.
 Yet again, I am motivated to give Steve Beste an enormous “Thank you!” for his dedicated effort to take FAA’s data, make complete sense of it (no small task), and to then work with the folks at Tableau to make this information available to you. Even better, you can adjust the data to your liking in ways I never envisioned with our earlier years of reporting these facts.
Thanks to Steve and his impressive skill set — and his willingness to spend his personal time — we now cover every aircraft registered since 2005, a year we picked because in April of that year FAA issued the first two Special Airworthiness Certificates (to Evektor‘s SportStar and Flight Design‘s CT).
Since 2005, more than 8,000 aircraft have been registered and that does not include about 4,000 former “fat ultralights” that FAA mandatorily turned into one-time Experimental LSA. Neither do we attempt to count aircraft with Standard (Part 23 or CAR 3) certification, which can be flown using a Sport Pilot certificate.
Smartphone Presentation
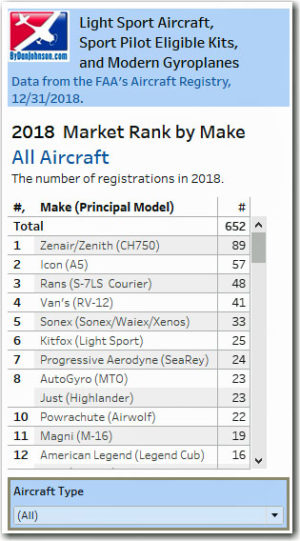
 Because a large number of you visit this website via your smartphone, you can now see images that fit your screen better (nearby image). Given a wide variety of phone sizes, screen resolutions, and browsers, not every phone will look like these images but the data is much more accessible via smartphone than it was when we launched late last fall.
Of course, iPads and desktops or laptops with their larger screen real estate can see the data more comprehensively, but even on those larger devices or computers, the data now make more sense thanks to Steve’s continuing effort to improve the look.
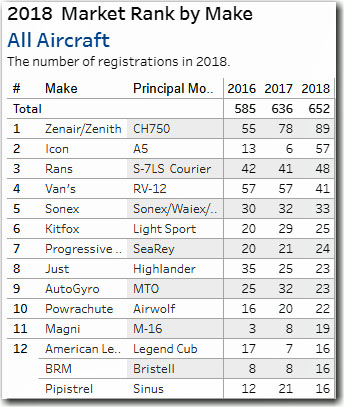
The “This-Yr Ranking” screen may be one of the most viewed elements of the page because it reveals sales interest for the present year …when pilots might be preparing to hand over a deposit.
Steve noted, “The current-year rank tables now show three years instead of just one. This will be important when the first 2019 data is presented. The rankings may then appeared skewed because they will display only one quarter of a year. Showing the extra years will give useful context.”
Hint: Turning your smartphone or tablet horizontally may reveal more information, depending on your device.
Kit-Built or SLSA?
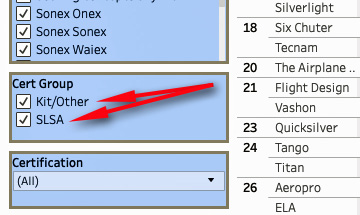
One last point: If your interest is limited to kit-built or fully-built Special LSA, you can adjust Tableau Public to show only those types by clicking in the “Cert Group” blue box (image). By default the lists show numbers for both types; click or tap to see only the ones you want.

The effort Steve and I have made together (well, mostly him; I primarily gave feedback or specific knowledge of aircraft) attempts to give pilots, businessmen, and government more data about the sector of aviation we enjoy most.
Any comments about how we can make this even more useful will receive careful attention.


Leave a Reply