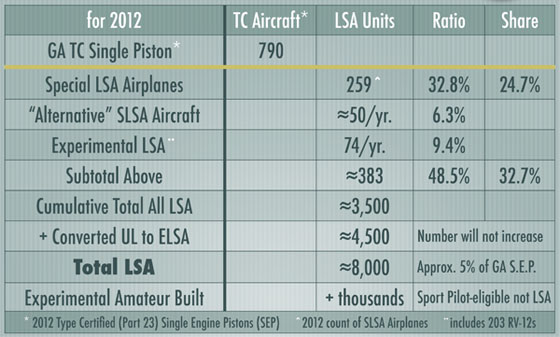

In talks I give at airshows, I’ve begun to focus on what I term the “real” LSA market. Many folks are confused and even our ByDanJohnson.com statistics and articles about market share ranking add to the fog obscuring the big picture. The chart below attempts to burn off that fog and provide a clearer understanding. However, the table — meant for use when I proceeded line by line in a live presentation — needs some explanations.
The chart attempts two tricks. The first goal was to contrast general aviation (GA) with Light-Sport aviation. We compare only to single engine piston GA aircraft as we saw that as the closest match. So the chart has at top left, a figure of 790, which is the number of Type Certified general aviation aircraft delivered in 2012, the latest full year of information at the time of the chart’s creation. Come down one line to see the total of Special LSA airplanes registered in 2012, again noting that LSA report registrations where the GA industry states deliveries; these two stats are not identical but are close enough for the purposes of this discussion. As you can see, the industry registered 259 aircraft. The term “Ratio” relates 259 to 790, showing LSA registrations to be about a third of GA single engine piston aircraft delivery. The term “Share” means the LSA portion of the sum of 790 + 259 or 1,049 total single engine piston aircraft.
Secondly, however, SLSA “airplanes” are not all the “aircraft” in the LSA fleet. “Airplanes” refer to fixed wing, three axis … basically more conventional aircraft. “Alternative LSA” refers to weight shift, powered parachute, gyroplane, and glider categories that add more registrations. We do not include the latter group in our market share rankings as the FAA database on these aircraft are suspect. The reason is the many different models and names and a general lack of database entry clerk awareness of them coupled with registration applications that likely confuse those clerks with different naming conventions. For example, a trike with a different wing is a somewhat different model but could use the same or a different name. Powered parachutes can be equally baffling to the uninitiated. Even though we can’t count them reliably (so we skip them, with regrets to those enthusiasts), they are real and they are being sold. They add an average of another 50 or more SLSA per year, which represents a bit over 6% of all GA aircraft sold.
Then, we have to add ELSA or Experimental (not factory built) LSA. More are coming but Van’s Aircraft’s RV-12 presently dominates this field, having registered 203 units by the end of 2012. All told, ELSA add an average of 74 units per year, which is nearly 10% of all general aviation single engine pistons delivered.
Sum these groups and you have an estimated 383 registrations of LSA types in 2012, a figure that is nearly half of the GA single engine pistons and a third of all aircraft manufactured in 2012. Yet, as the late night infomercials boast, “That’s still not all!” Adding to the total of LSA aircraft are many former two seat ultralights that were registered as a kind of special ELSA during a grace period. That period ended some years ago, so no more will be added, but we estimate that at least 4,500 examples are still flying. Add them all and you see more than 8,000 Light-Sport Aircraft, which accounts for about 5% of the entire single engine piston fleet in the USA … but that still doesn’t fully describe the sector.
We finish the picture by noting that many Experimental Amateur Built (the so-called 51% rule airplanes) can be flown by someone possessing a Sport Pilot certificate or using a higher certificate without a medical to operate as a Sport Pilot. We don’t provide an estimate, but cautiously call this “thousands” more. Many people call these “Light-Sport Aircraft” but they are not; they are EABs. Likewise some folks still call the Sport Pilot certificate a “Light-Sport license,” which is an incorrect term. We prefer to call these “Sport Pilot-eligible” aircraft using a phrase coined by EAA staffer Ron Wagner.
We hope the chart above helps to clarify the true size of the LSA market. Remember, these figures only refer to the United States. Many thousands more fly in other countries. Next, let’s look to the future.
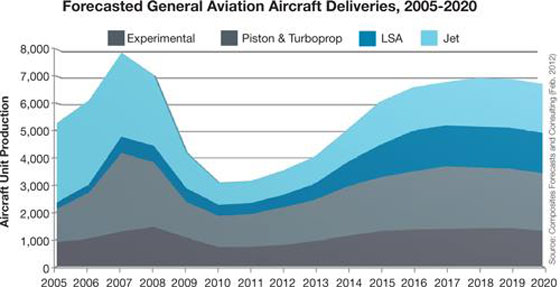
The graphical chart comes from Barr Group Aerospace. Chart lovers can find many more at this website focused on general aviation (most of the info is for larger, working aircraft). The following chart shows the history — including the plunge from 2007 figures to the depths of 2010, a slide of greater than 50%. It also gazes into a crystal ball and attempts to show future trends. Right or wrong, the view of the statisticians behind this chart suggests a strong role for Light-Sport Aircraft at about 23% of all aircraft including jets and Experimentals. Jets are expected to grow as are Experimentals. It looks less rosy for piston and turboprop perhaps as LSA and EABs will capture some of these sales. Then, we have to contemplate the arrival of a new wave of four seat or larger aircraft from the flock of non-legacy companies currently building two seat LSA … but that’s a story for another article.


Leave a Reply