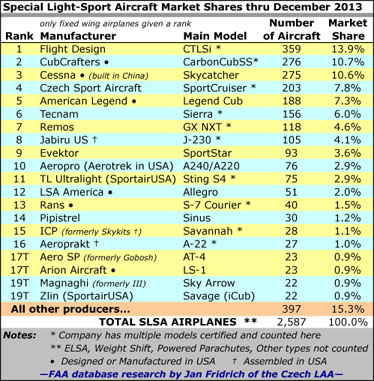

As always, we remind you that all numbers here are derived from FAA’s N-number registration database and are subject to data entry errors. Figures presented are not identical to sales recorded by the companies though over time the numbers draw closer.

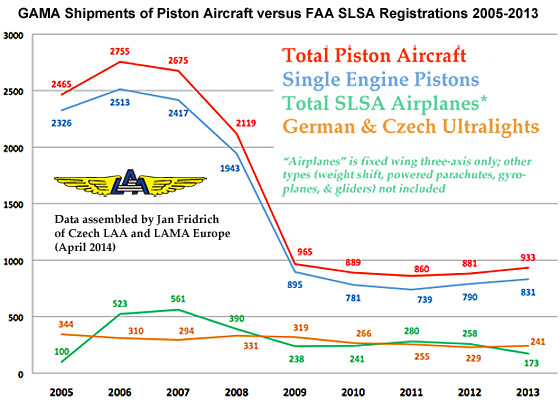
This chart, created by Jan Fridrich for a presentation at Aero in Germany, shows trend lines for several categories. While LSA continue to slump, some see this as the “bottom” and reported order taking over the last 18 months supports future improvement. Of interest is the brown line for German and Czech ultralights or microlights (similar though slightly lighter than U.S. LSA). Note its volume similarity to LSA and the steadiness of the line throughout the economic downturn from 2008 to 2012. Germany and the Czech Republic are two of the most active countries in Europe.
UPDATE: May 27, 2014 — “A vigorous debate ensued …” might be one way to refer to a four-way discussion from around the globe. Over the last few days, LSA industry folks in distant lands worked on market share details. Michael Coates is the Australian-based U.S. distributor for Pipistrel, an aircraft fabricated in Slovenia and assembled as a LSA in nearby Italy for shipment to the USA. My Czech-based associate, Jan Fridrich, was in China again because his country works with that nation as they build a personal aviation sector virtually from scratch. From our corners of the world we tried to resolve a problem that regularly occurs in our study of the FAA registration database. Pipistrel maintained their SLSA airplane numbers were stronger. Jan and I communicated and finally agreed that we were underreporting their numbers. The chart below has been modified to reflect a truer situation, sharply moving Pipistrel upward from 20th to 14th rank. Essentially, the problem stems from some Pipistrel aircraft being registered as “gliders,” which is one of those categories Jan and I do not feel we can consistently count with accuracy. After Jan studied the database we chose to update the chart with the understanding that our next reporting may see another minor adjustment. As with many statistical evaluations, these reviews often get better as the survey gets larger over a longer period of time. Meanwhile, congratulations to Pipistel for improving their standing … and for informing us. If other sellers believe their registrations are reported in error, we’d like to hear about it so we can do our best to deliver quality, accurate information. —DJ
We are past due for a market share update and several of you have written to ask. As most readers know, I create my report from information assembled by my LAMA associate and friend Jan Fridrich who puts hours into the tedious duty of sifting through FAA’s database. It isn’t only time consuming, exacting work. He must also make many determinations as FAA’s database is not always clear as to model types or other descriptions. As many of you are aware, we do not report weight shift, powered parachutes, gyros, or motorgliders as those are aircraft types we cannot accurately count. I wish we could report those “alternative aircraft” — doing so would make the totals more reflective of the true LSA market — but we cannot. Jan has also been unusually busy going to many meetings … the kind you would not care to attend: long, dry meetings in various countries where regulators and industry leaders go over rules in excruciating detail. Someone has to do it and I’m thankful for people like Jan who endure these sessions. For this reason, I was unwilling to push harder for his study of the database. However, he has done it again so a hearty THANK YOU, JAN FRIDRICH for your dedication to this industry.
As I’ve written and as many are aware 2013 was not a strong year for SLSA registrations. It was an improved year for sales but after so many down-economy years manufacturers had reduced their manufacturing capacity — achieved by releasing employees, employing less manufacturing floor space, maintaining smaller raw material inventories, keeping fewer engines on hand and so forth. So, when sales mounted a comeback in 2013, builders were unable to keep up. Backlogs stretch out to a year for some companies. That may improve in 2014 as they cautiously increase their rates of production but meanwhile several companies tell customers it can be several to many months before a new order will be available to them. So far first quarter numbers for 2014 continue to reflect these delays but I have received several comments that new LSA are beginning to arrive more regularly.
Cessna, as one notable example, slipped from second to third and will continue moving lower now that they halted production. Their exit alone caused a drop in the totals. Yet others, like Icon Aircraft, will eventually hit the chart and move up as they begin to deliver from their list of 1,000+ customers holding order positions. One industry expert told me, “My input [is] that 2013 will be the bottom of the LSA market, which means there is nowhere to go but up. If you counted all ELSA 2013 was really pretty decent, with RV-12 leading the pack. CubCrafters’ order book is very healthy, too.” To that I add the following thought …
Entire LSA Market — I want to refer you to a different market report I issued earlier and note that besides weight shift, powered parachutes, gyros, or motorgliders, we also do not report ELSA (kit LSA). Again, the data entry process is difficult for FAA clerks because so many makes and models are present to confuse those less involved with the sector. Experimental Amateur Built aircraft can be flown by Sport Pilots and are sometimes incorrectly called Light-Sport. ELSA may receive their airworthiness certificate only if they are identical to the SLSA version accepted by FAA, however, afterward they can change. With 136 SLSA models, it doesn’t surprise me that errors creep into the database but for our charts to make sense year-over-year, we report only the most identifiable group: Special LSA airplanes. Yet this means that to know the whole market size you must add a substantial, growing percentage (as much as 50% more) to include those other aircraft.
Chart Explanations & Disclaimer — If you compare numbers from one year to the next, you may see changes you cannot explain. For example, a company’s numbers can go down if, for example, aircraft are taken out of service due to theft, damage, or sale outside the USA, which means they may be removed from FAA’s database. Some companies in the USA also distribute to Canada or Mexico and LSA going to those countries will not be counted in our chart even while they rightly call them a sale.
Comparing “Total” Figures — Rob Rollison of Aerotrek, besides doing a steady job of selling his reasonably priced A220s and A240s, often comments that our chart numbers do not perfectly reflect all SLSA that his company has registered. If a LSA is destroyed, by a hangar collapsing on it let’s say, that aircraft will eventually come off the FAA database making it appear that it was never sold. Thus, FAA’s current registry does not fully state the total registrations that ever occurred. “If Model A Ford cars were in some current U.S. registry, we’d see 50 of these antiques today, not the millions Ford once sold,” noted Rob. He is correct; our chart (and FAA’s database) does not include every SLSA ever registered. Counting all of them would make the total somewhat larger. However, we stick to our same methods in the interest of keeping our chart consistent through the years even though it undervalues the industry’s true sales. As further explanation, you can see the chart shows 76 Aerotreks models in the FAA database. Rob has provided an exact accounting of every U.S. registration he ever made and his figure is at least 83, though he notes four were damaged and some others transitioned to ELSA status, which suggests our reported figures are very close. Until we can collect actual — and honest, valid — sales data from all manufacturers, our chart is the one we present. The market is truly larger than either chart suggests. We appreciate if all readers keep this in mind when studying the LSA Market Share Chart.


Leave a Reply